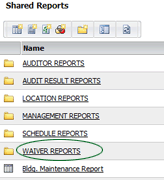
OPTIONAL FEATURE - Contact your RizePoint representative to enable/disable this option. |
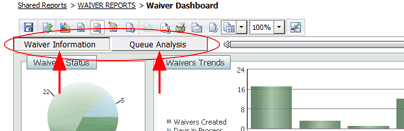
To view the Waiver Dashboard report:
The report contains two pages: WAIVER INFORMATION and QUEUE ANALYSIS.
Buttons are provided at the top of the report to allow you to quickly
switch between pages.
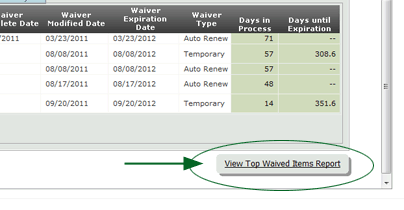
In addition, when you scroll to the very bottom of the dashboard report,
a button appears in the lower right corner that allows you to view the
TOP WAIVED ITEMS report.
| This waiver report requires an Enterprise Intelligence license. |
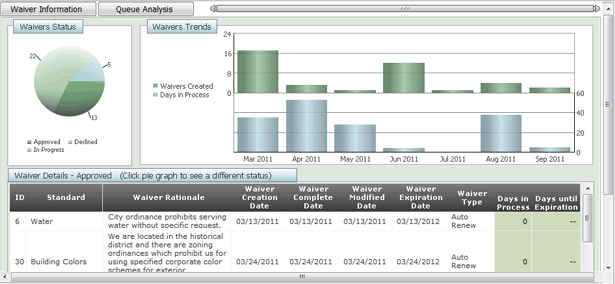
| WAIVER INFORMATION |
Click the WAIVER INFORMATION button to display information on waivers
during the previous 12-month period.
![]()
The following information is included on the Waiver Information page of the dashboard:
Notice that as you place the cursor over an element on the dashboard,
a "tool tip" is displayed that provides information for that
element.
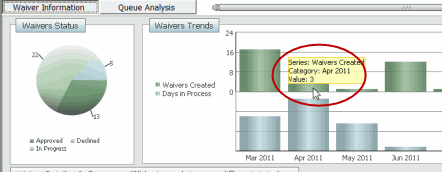
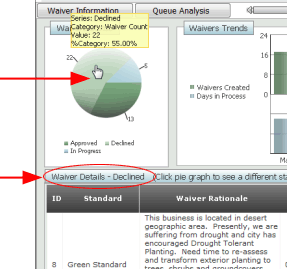
When you place the cursor over the various sections of the pie chart
on the left, not only is additional information provided, but also notice
that the cursor changes to a "hand" cursor, indicating that
the field is "clickable".
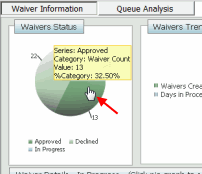
When you click on one of the sections of the pie chart, details of that
section are displayed in the lower section of the report.
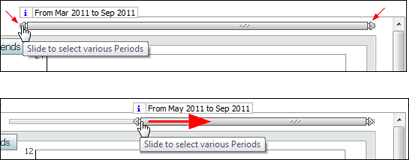
A Date Slider is also provided above the Trend section of the report
page that allows you to adjust the time period included in the report.
As you drag either end of the slider toward the other end, the date range
of the report narrows, allowing you to focus on a smaller period of time.
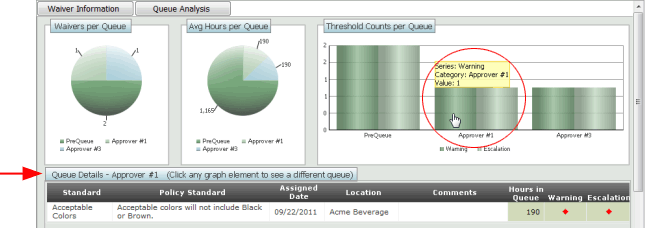
| QUEUE ANALYSIS |
Click the QUEUE ANALYSIS button to display information about the queue
in which waivers are currently placed.
![]()
The following information is included on the Queue Analysis page of the dashboard:
All of the fields on this page of the dashboard are clickable. When
you place the cursor over any element at the top of the dashboard, it
displays additional information in a "tool tip", and it changes
from and "arrow" cursor to a "hand" cursor, indicating
the element is "clickable".
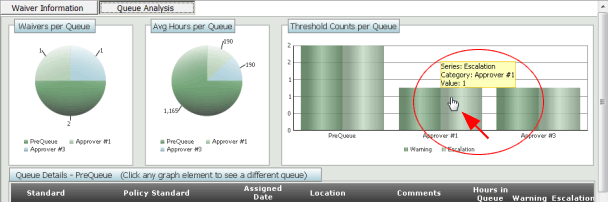
Clicking on an element displays information about that element in the
Details section at the bottom of the page.