
| Search-Driven Analytics is RizePoint's custom reporting solution. Contact your RizePoint Account Executive to schedule a demonstration and get pricing details. |
Search-Driven Analytics (SDA) business intelligence reporting is designed to enable a RizePoint customer administrative user to build custom reports for stakeholders, create shared reporting, research ad hoc analysis scenarios and analyze the results with ease. Creators use keyword searches with the similar look and feel of browsing the internet wherein you type in your search criteria, and view the results instantly.
SDA users are classified in two groups: Creators (the RizePoint customer administrator) and Consumers.
An SDA Creator:
An SDA Consumer:
To learn more about the permissions and functionality available to SDA Creators and Consumers, see:
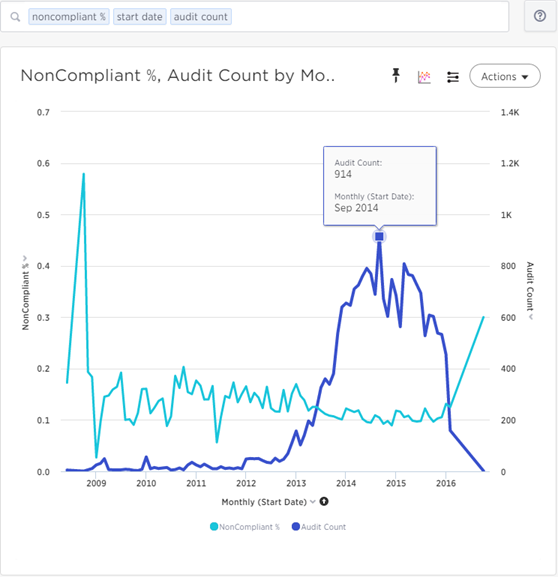
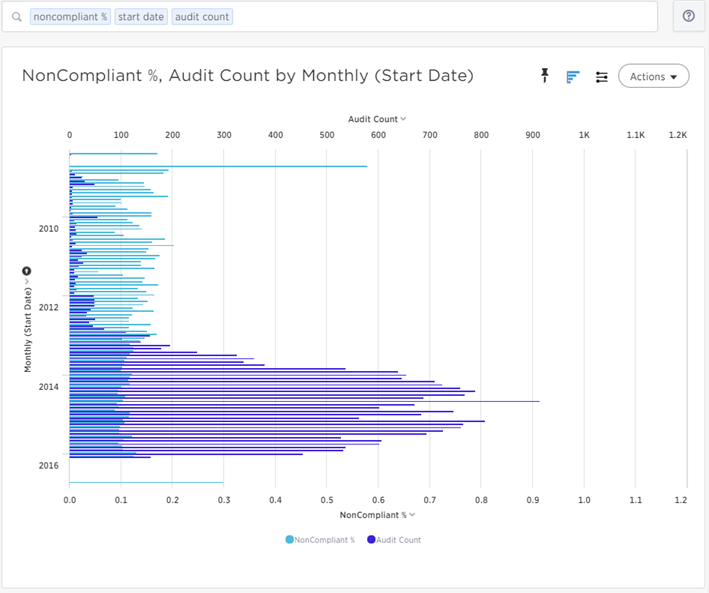
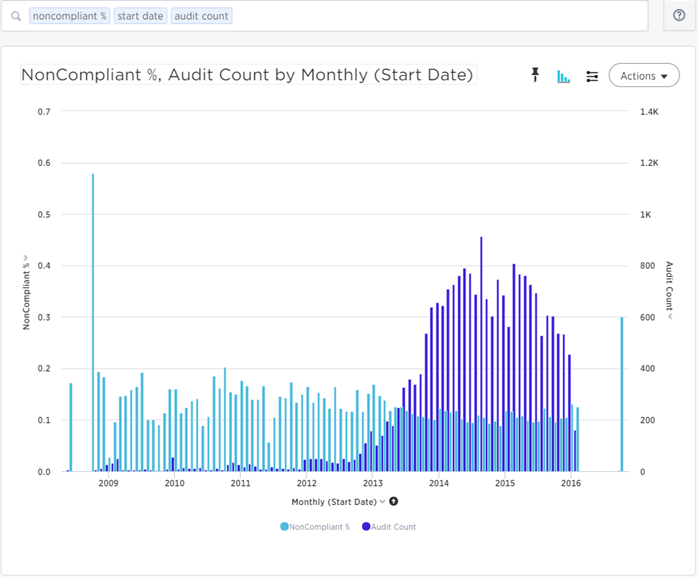
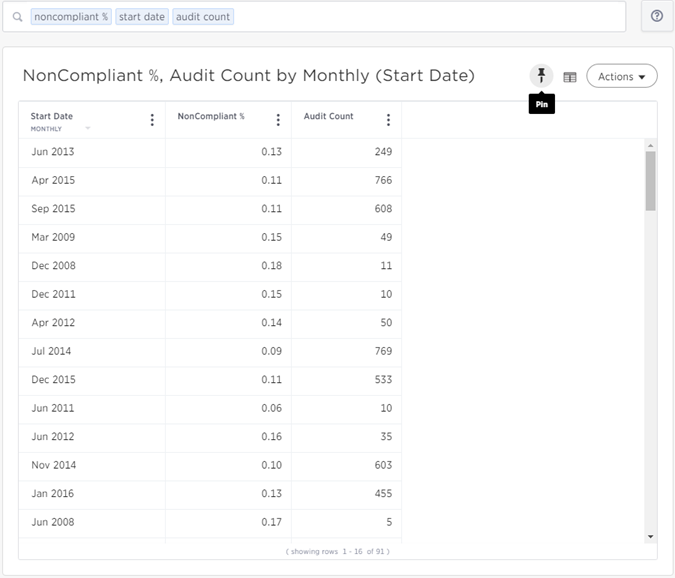
The pinboards below were created to illustrate the percentage of non-compliant responses over a specified period of time. Search-Driven Analytics enables the Creator to select a visualization format from a large selection of charting tools such as line graphs, bar charts, maps, columns, scatter graphs, pie charts and many more.
In the sample pinboards below, the same data is visually displayed in four different formats: a line graph, bar chart, columns and a table.


