
To conduct a search in Search-Driven Analytics (SDA):
From within the RizePoint application, navigate to REPORTS > SEARCH-DRIVEN ANALYTICS.
Click
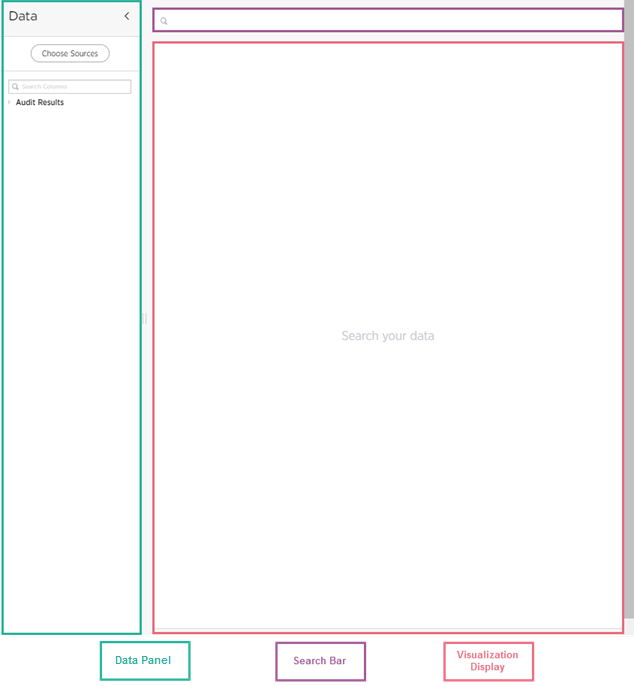
SEARCH in the top menu. The Search page will display the following:
•
Data Panel - Use this panel
to select a data source, then view the attributes and measures available
for reporting from the data source.
•
Search Bar - Type your search
criteria in the Search Bar.
•
Visualization Display
- View results and configure the visualization of those results in
the display area.
To begin
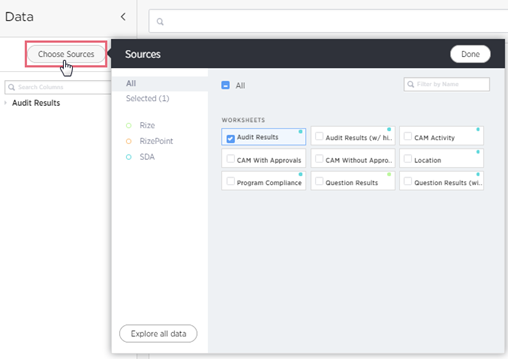
a search, select a data source by clicking CHOOSE SOURCES in the Data
Panel. A list of all available data sources—called
Worksheets—will display in the SOURCES selection
box. Click the check box next to the worksheet from which you want
data to be available.
| RizePoint recommends choosing only one single worksheet for each search. Combining worksheets could result in execution errors and/or unexpected results. |
| Notice that after you click the check box next to a worksheet, the name of the worksheet displays in the Data Panel to the left. |
| SDA data sources have been configured by RizePoint for your use and contain a combination of the relevant attributes and measures of your data. |
Click
DONE after you have selected the data sources from which your SDA
report will be designed.

In the
Data Panel on the left, click the toggle arrow next to the name of
a data source to expand the list of available attributes and measures.
Click the arrow again to collapse the list.

Enter the search criteria by typing it in the search bar. Alternatively, you can double click a specific data source from the Data Panel list and the search term will autopopulate in the search bar.
| Notice that as you add or remove search criteria in the search bar, the visual representation of the data loads or updates in the visualization display in real time. SDA automatically selects grids or charts that it determines are the best visualization choice for the search results. An SDA Creator can change the visual display to a different format. See Change Report Visualization. |


All SDA
searches are driven by keywords in a similar way to searching
on Google or Amazon. Keywords pull up data. To view all available
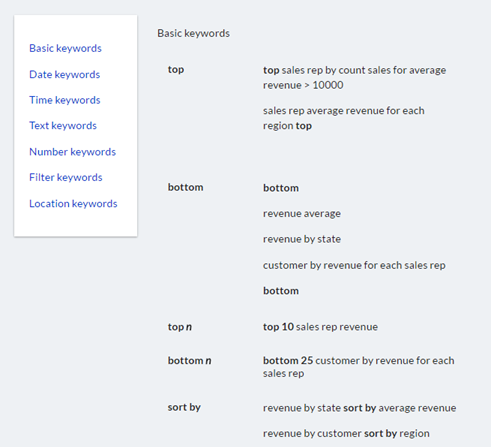
SDA keywords, navigate to the SDA
Help menu. Select HELP > KEYWORDS. A help menu of SDA
keywords will display.
 |
