Creating a New Dashboard

Video Training for Creating a New Management Dashboard
When you create a new dashboard, you are not creating from scratch.
Rather, you are configuring how the new dashboard will display by selecting
from configuration options in the New Dashboard screen.
To configure a new management dashboard:
- Go to Reports > Management
Dashboards.
The Management Dashboard screen displays similar to the one below.
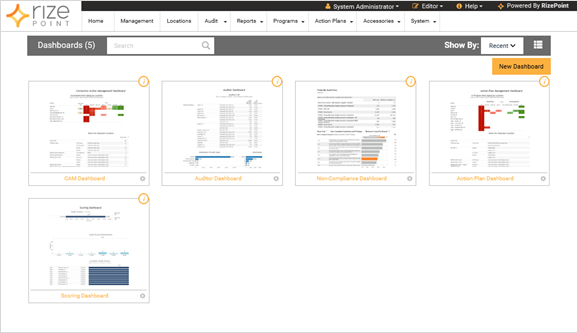
- Click the NEW DASHBOARD button.
The New Dashboard screen displays. All tabs with an asterisk
are required for dashboard creation.
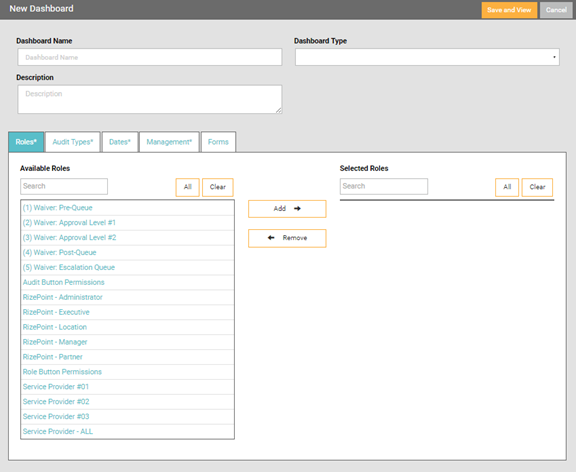
- In the Dashboard Name field, enter a name for the new dashboard.
- From the Dashboard Type drop-down list, select the type of dashboard
you want to create.
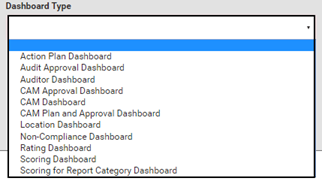
Action Plan Dashboard
- displays the data for action plan items that are days overdue, action
plans coming due, and currently due. For a detailed description of
this dashboard, see Action Plan
Dashboard.
Audit Approval Dashboard - displays
data for the Audit Approval Results 2.0 feature. For a detailed description
of this dashboard, see Audit
Approval Dashboard.
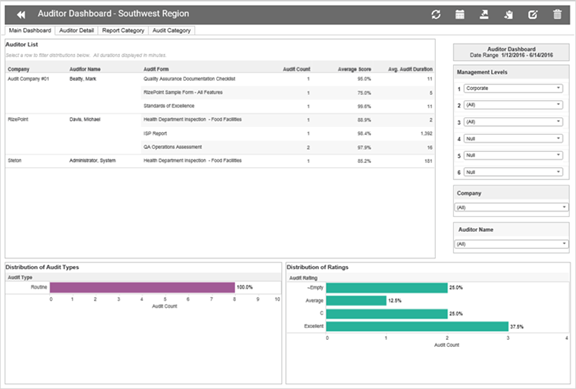
Auditor Dashboard - displays
data for audit companies and auditors conducting the audits, such
as counts, scoring averages, average audit duration, ratings, and
types of audits. For a detailed description of this dashboard, see
Auditor Dashboard.
CAM Approval Dashboard - displays
corrective action plan approval information related to approval steps
and durations by location. For a detailed description of this dashboard,
see CAM Approval Dashboard.
CAM Dashboard - displays
data for corrective action plans, such as days overdue, coming due,
and due for action plan items.
CAM Plan and Approval Dashboard
- displays features of the CAM Approval and the CAM Dashboards providing
an improved view of CAM items. For a detailed description of this
dashboard, see CAM Plan
and Approval Dashboard.
Location Dashboard -
enables you to select a location, then subsequently view audit result
data across locations for a given date range. For a detailed description
of this dashboard, see Location Dashboard.
Non-Compliance Dashboard - displays
the data for non-compliant response counts and percentages at varying
levels of view, such as audit form, audit type, report category, and
audit category. For a detailed description of this dashboard, see
Non-Compliance Dashboard.
Rating Dashboard - displays
information about audit result trends. It can be filtered to display
by Management or Category, then can be further filtered to display
by audit type, audit form, report category and audit category. For
a detailed description of this dashboard, see Ratings
Dashboard.
Scoring Dashboard - displays
the overall percentage score trends based on the management hierarchy
and location level. For a detailed description of this dashboard,
see Scoring Dashboard.
Scoring for Report Category Dashboard
- displays Report Category scores and their associated drill-down
options. For a detailed description of this dashboard, see Scoring
For Report Category Dashboard.
- In the Description field, enter a description for the new dashboard.
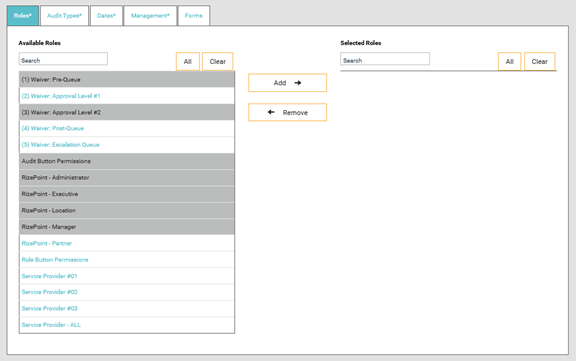
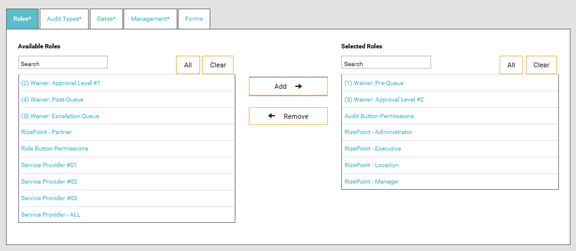
- From the Roles tab, select all the available Roles you wish to
display in the dashboard, then click the ADD button. (required)
Roles Tab
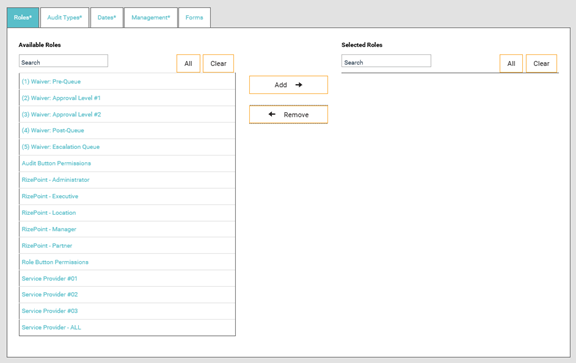
Roles Tab with Selected Roles
Roles Tab with Added Roles
- Select the Audit Types tab. (required)
- Using the same method of selection you used for the Roles tab,
select the Audit Types to include in the dashboard.
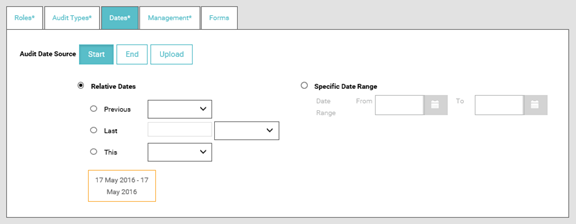
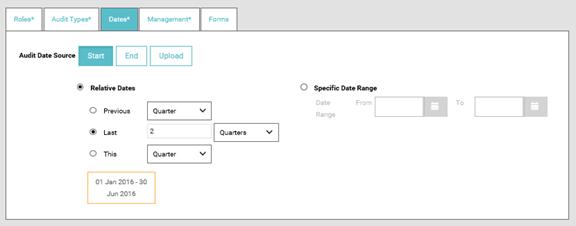
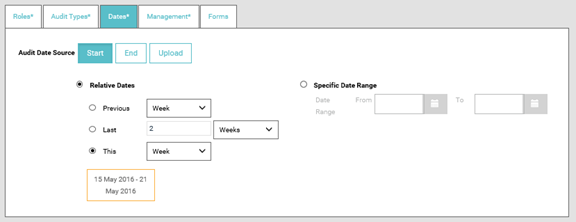
- Select the Dates tab. (required)
The Dates tab displays. The default date range selected always displays
in the orange box at the bottom of the tab. Currently, it shows the
current date for the date range—17 May 2016 - 17 May 2016.
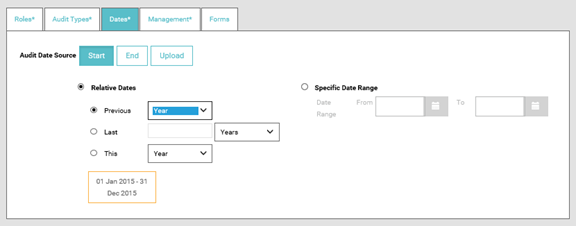
- Select the date range you want to display for the dashboard.
As you select different date options, the date range is modified according
to your selection so you can validate the date range.
- Select the Management tab. (required)
The Management tab displays your current management tree.
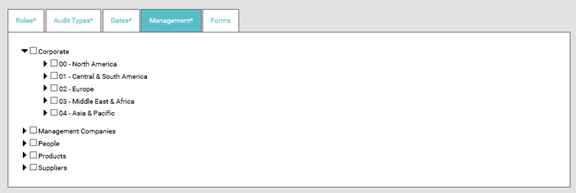
Select the management hierarchy
you want to include in your dashboard.
You can only have one branch of a management hierarchy included in
the dashboard. Once selected, the other branches are unavailable for
selection.

Select the Forms tab. (optional)
Add the forms that you want to
include in the dashboard. If you don't select any forms, it will default
the display to show all forms.
Click SAVE AND VIEW.

The dashboard you configured displays.
For more information on dashboard navigation, see Dashboard
Navigation.
For more information on how to drill down and view the specific data
for each standard dashboard, see Standard
Dashboards.


